Get started
Mailmeteor lets you track emails in real-time and access detailed metrics for each of your campaigns. But we wanted to do more to help you understand how your emails perform over time. So we recently added a brand new Analytics page.
Analytics is a Premium feature.
For in-depth insights into your email performance, upgrade to one of our paid plans or apply to our Education Program.
How to view your email analytics?
The Analytics page gives you a full overview of your email activity. We wanted this page to provide a broader overview of how your account performs overall. Here’s how it looks in the Mailmeteor Dashboard ⤵️
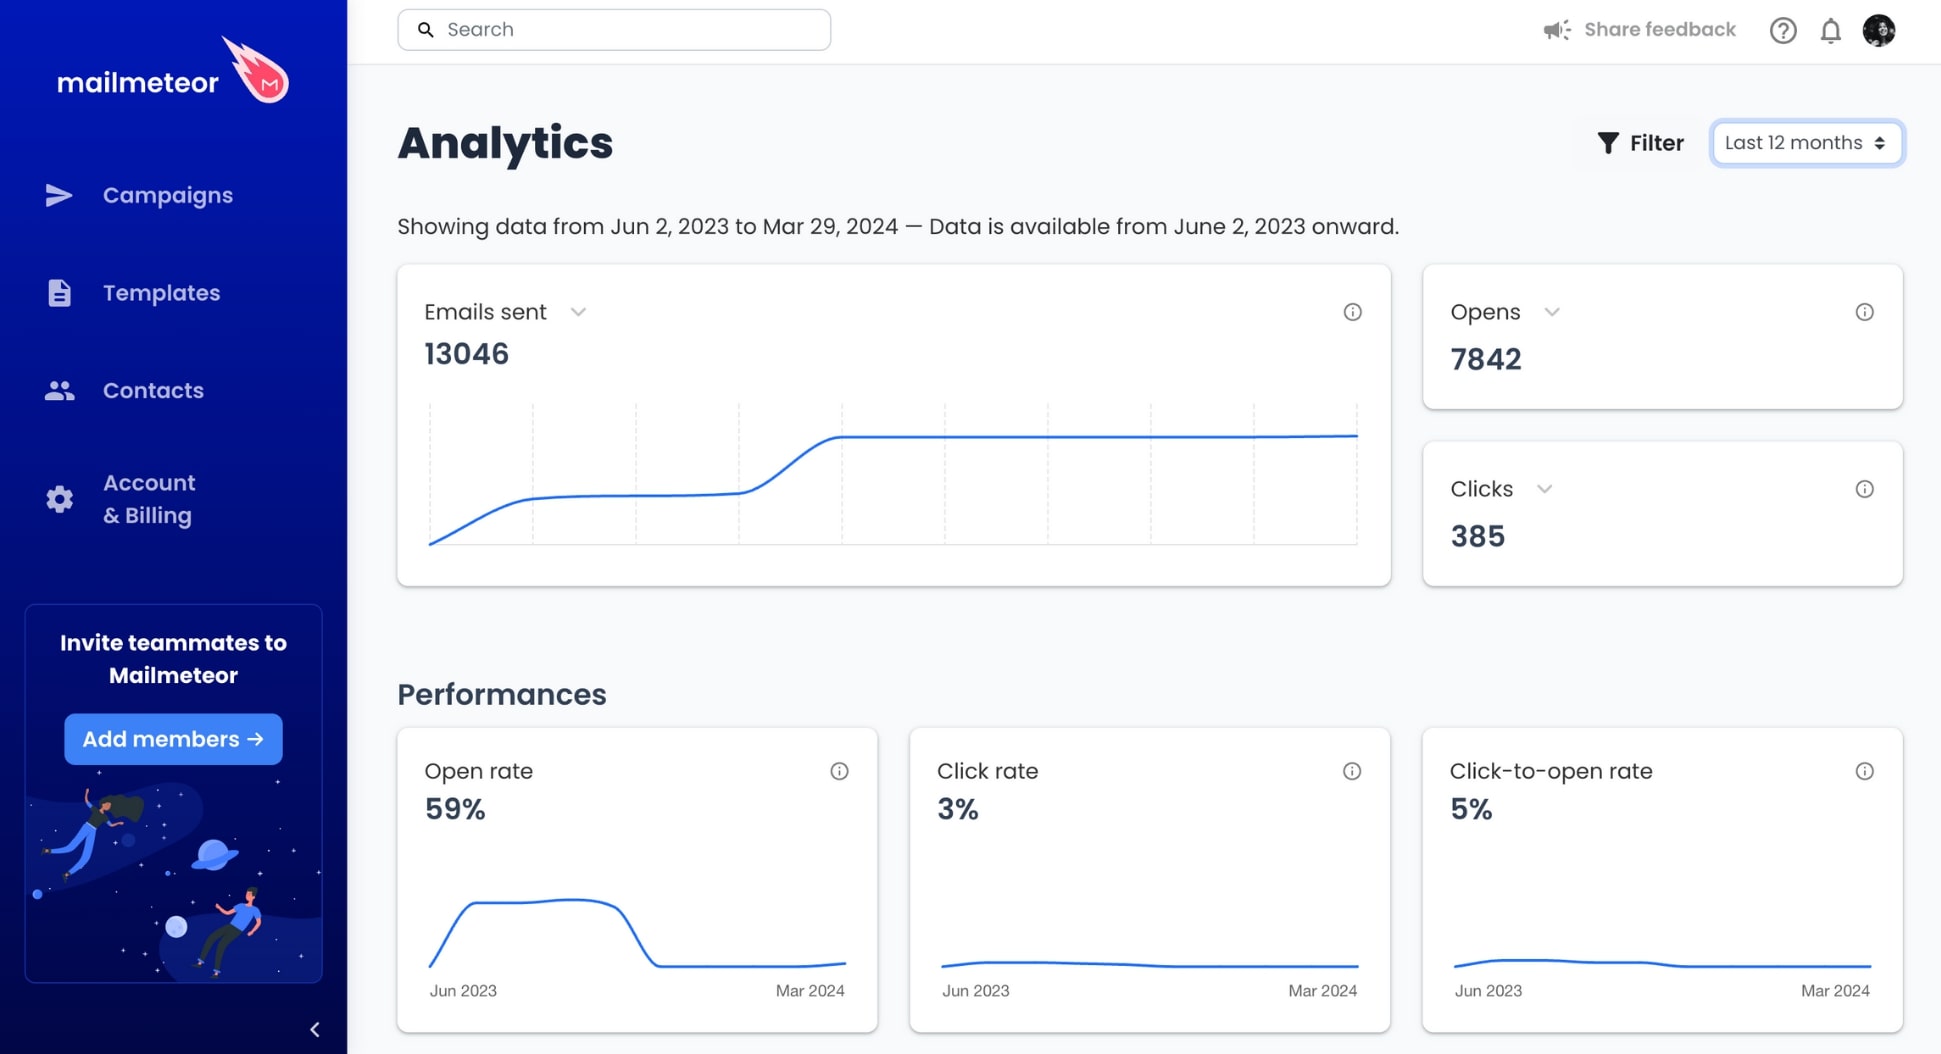
Make this page feel like home! You can customize your Analytics dashboard in just a few clicks to see all your crucial data in one quick view. To do so, click on the arrows next to each metric and select the one you want to display.
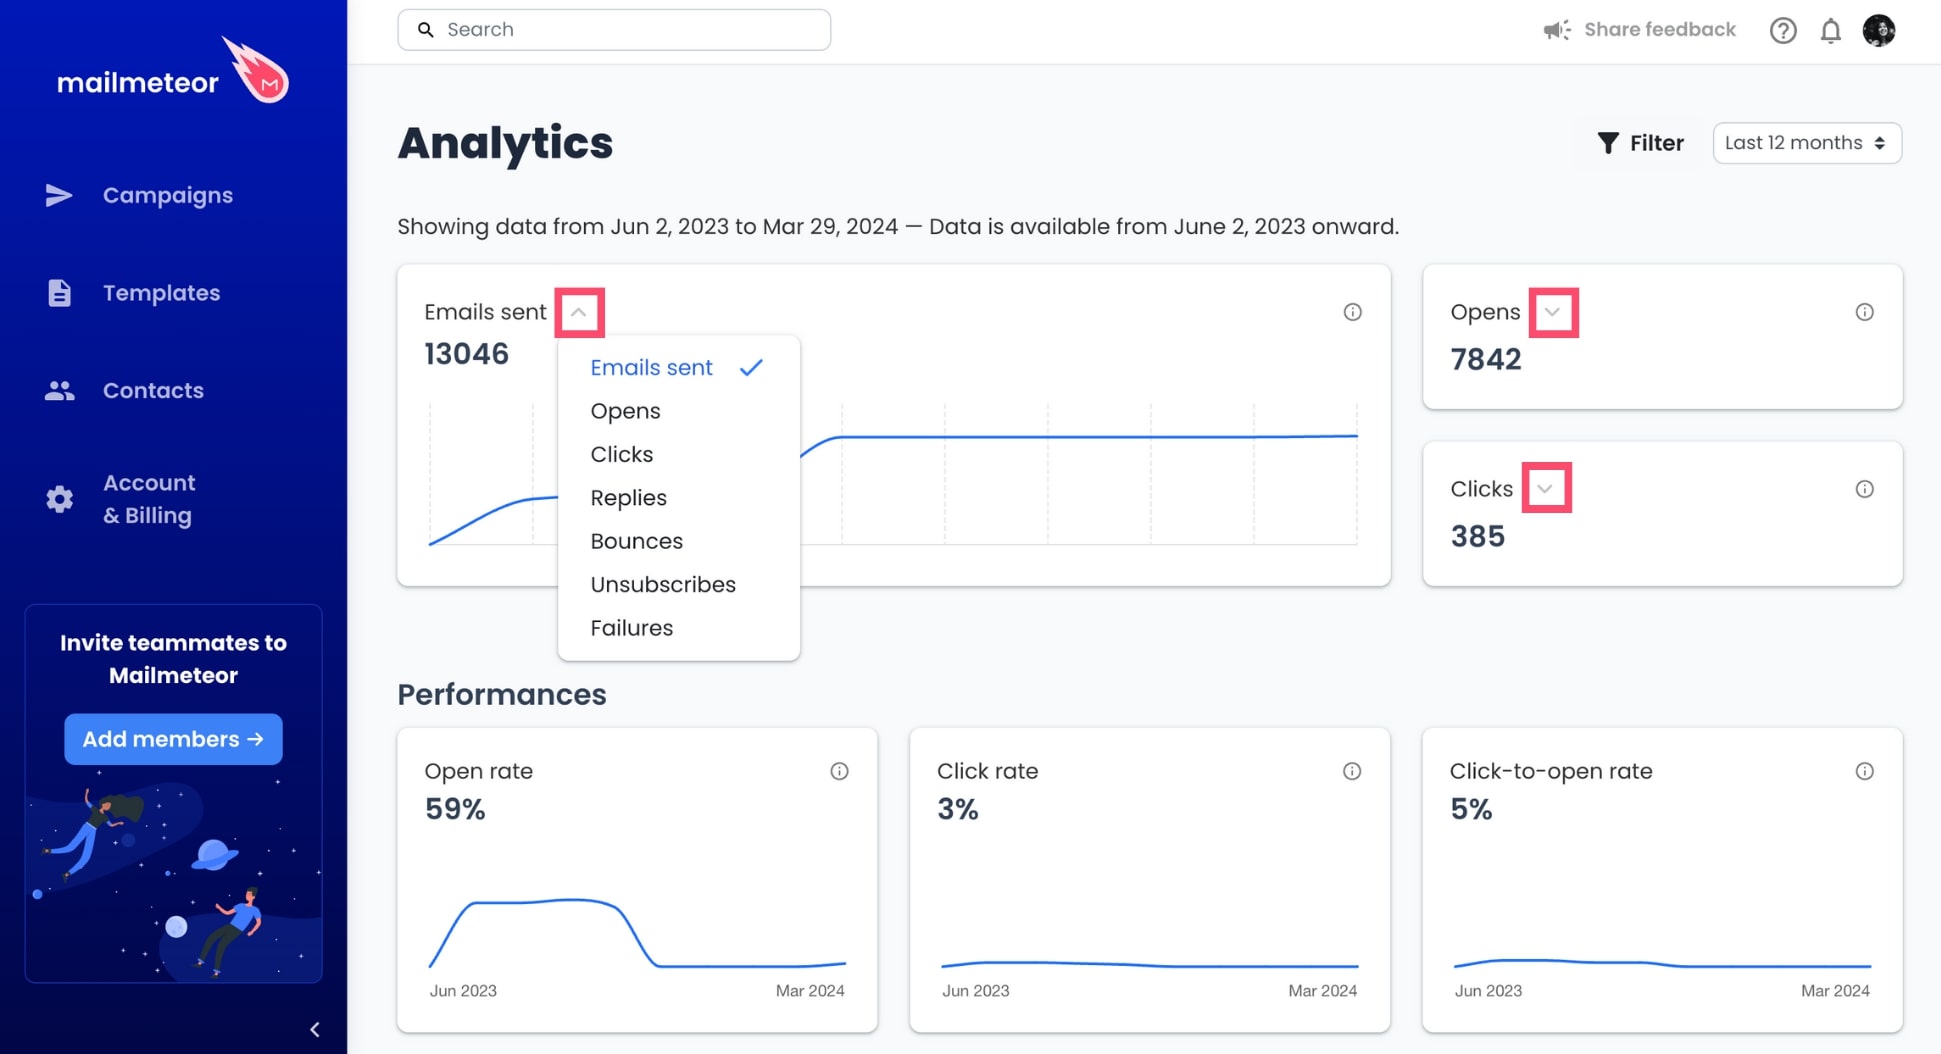
Need a more granular approach? You can select a period of time, to see how your emails performed over the past days or months. To do so, click on the date range and select Today, Last 7 days, Last 30 days, Last 3 months, Last 12 months, or All time.
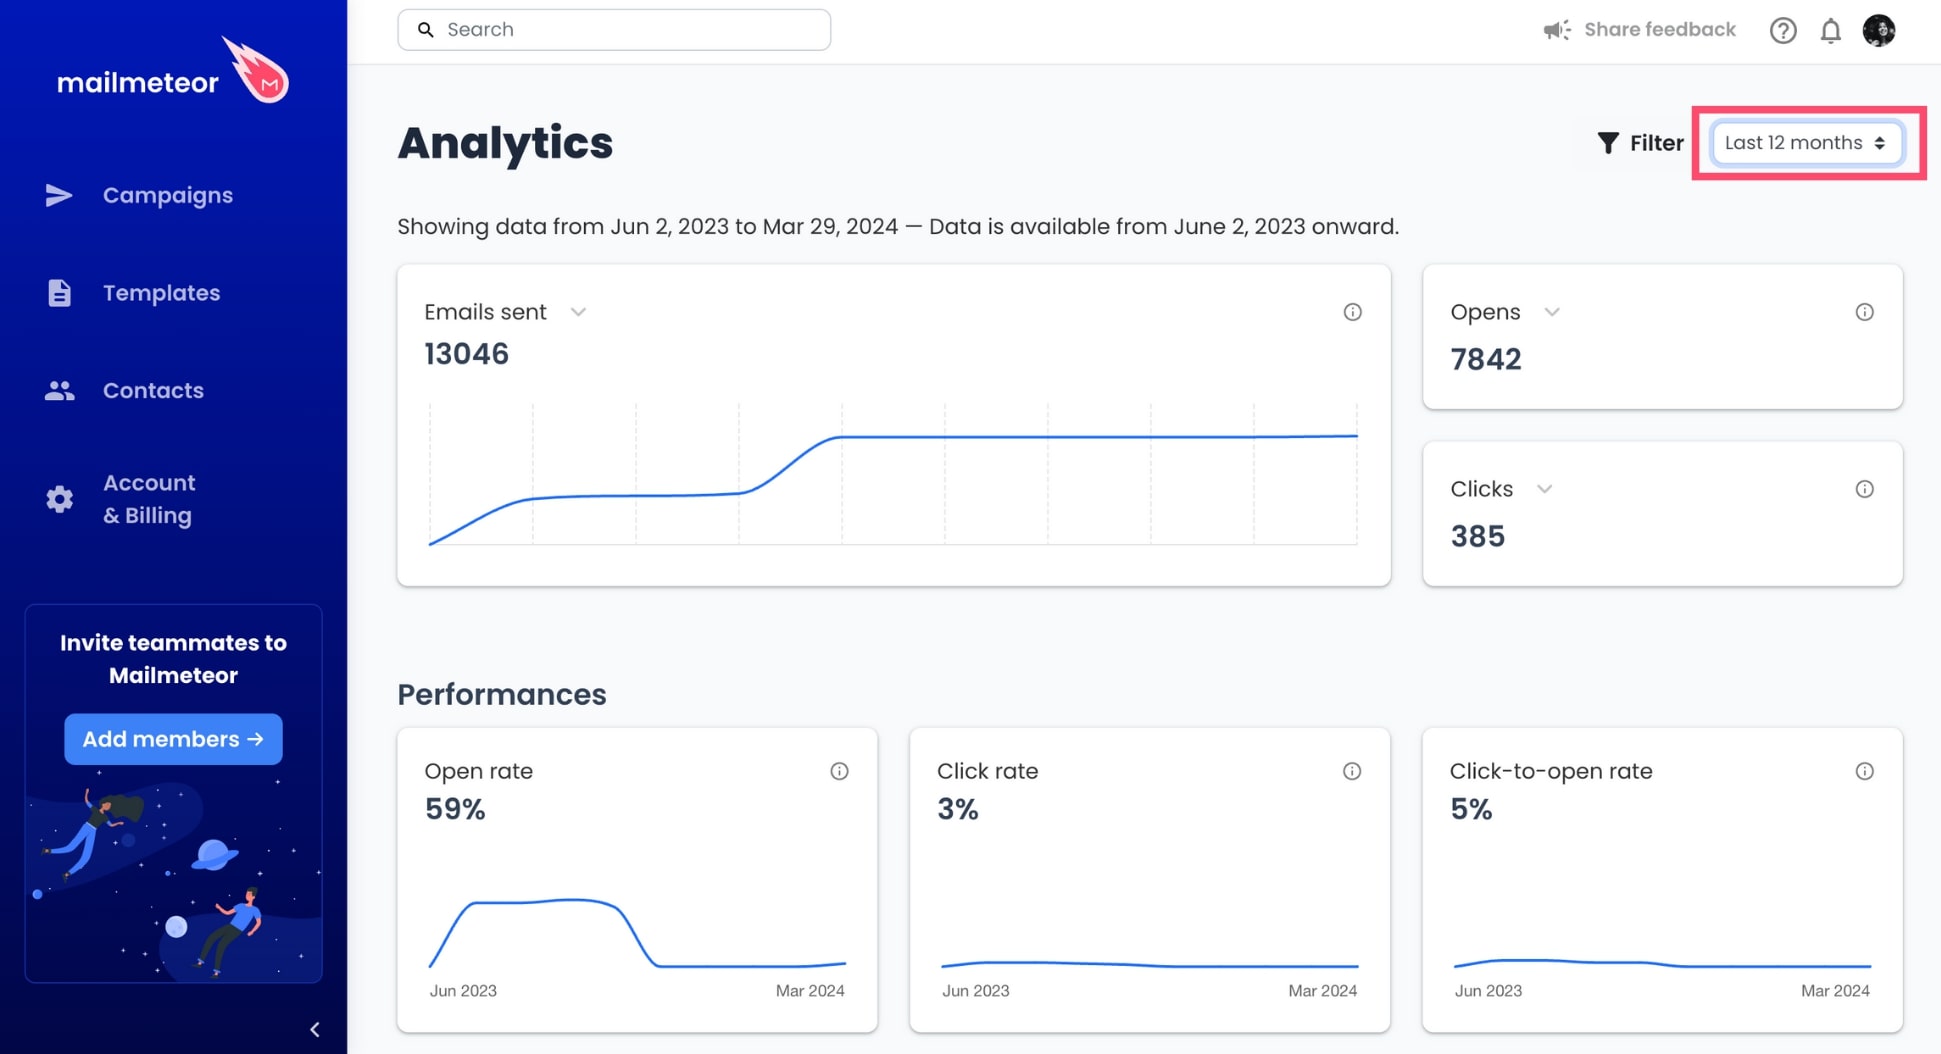
You can also filter per campaign to retrieve even more information. To do so, click Filter, select Campaign, enter the ID of your campaign and click Apply.
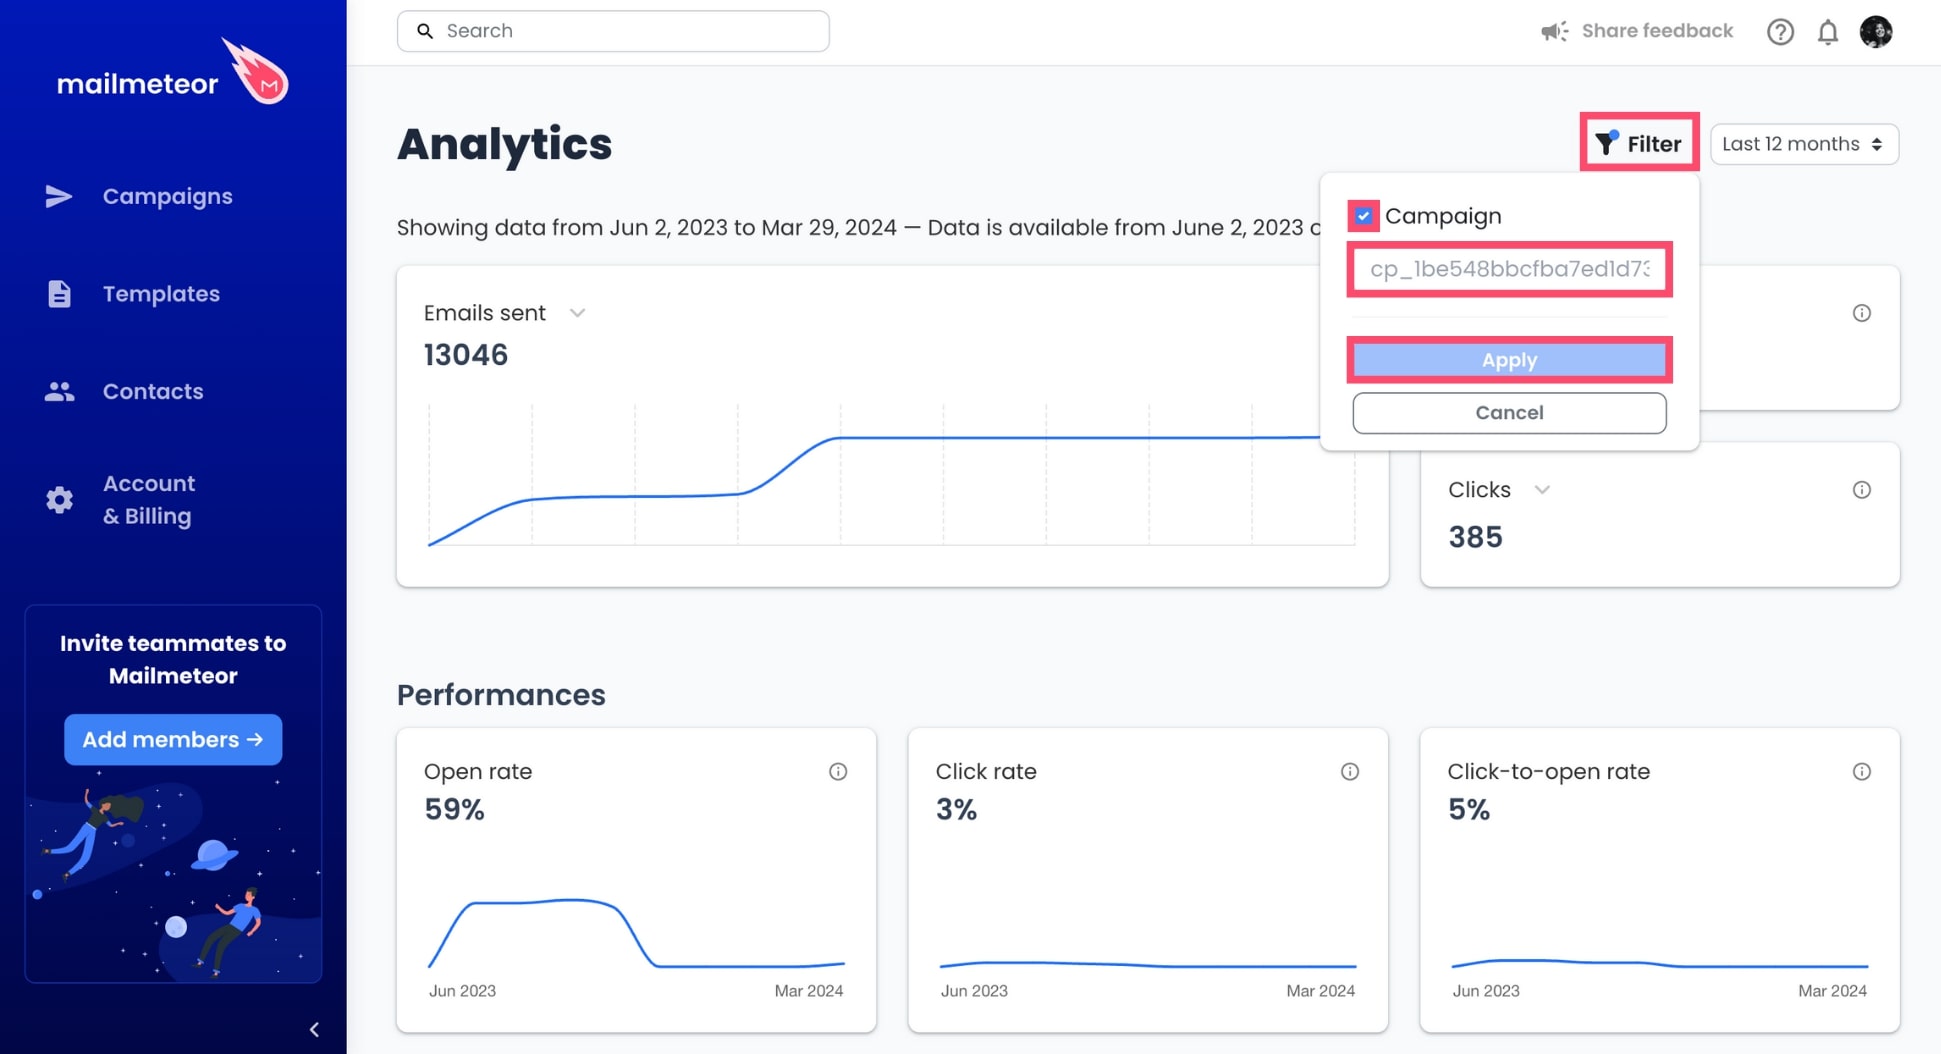
What metrics can you find in your Analytics dashboard?
Your Analytics dashboard lets you monitor basic metrics, such as:
- Email sent: This is the total number of emails you have sent during the selected period.
- Opens: This is the total number of people who opened your emails during the selected period.
- Clicks: This is the total number of people who clicked a link in your emails during the selected period.
- Replies: This is the total number of people who replied to your email during the selected period.
- Bounces: This is the total number of emails that were returned due to issues on the recipients’ end, such as full mailboxes or delivery restrictions.
- Unsubscribes: This is the total number of people who unsubscribed during the selected period.
- Failures: This is the total number of emails that were not successfully delivered due to reasons such as invalid email addresses, bounces, or technical issues.
You can also view more advanced performance indicators, such as:
- Open rate: This is the number of opened emails divided by the number of successfully delivered emails.
- Click rate: This is the number of unique clicks divided by the number of successfully delivered emails. It provides insight into how successful your emails are at generating clicks.
- Click-to-open rate: This is the number of unique clicks divided by the number of opened emails. It measures how relevant the content of your email is to those who open it.
- Reply rate: This is the number of emails that have received a reply divided by the number of successfully delivered emails.
- Unsubscribe rate: This is the number of unsubscribes divided by the number of successfully delivered emails. It indicates the percentage of recipients who have opted out of receiving further communication.
- Delivery rate: This is the percentage of emails successfully delivered to recipients’ inboxes, excluding any that bounced or were undeliverable for various reasons.
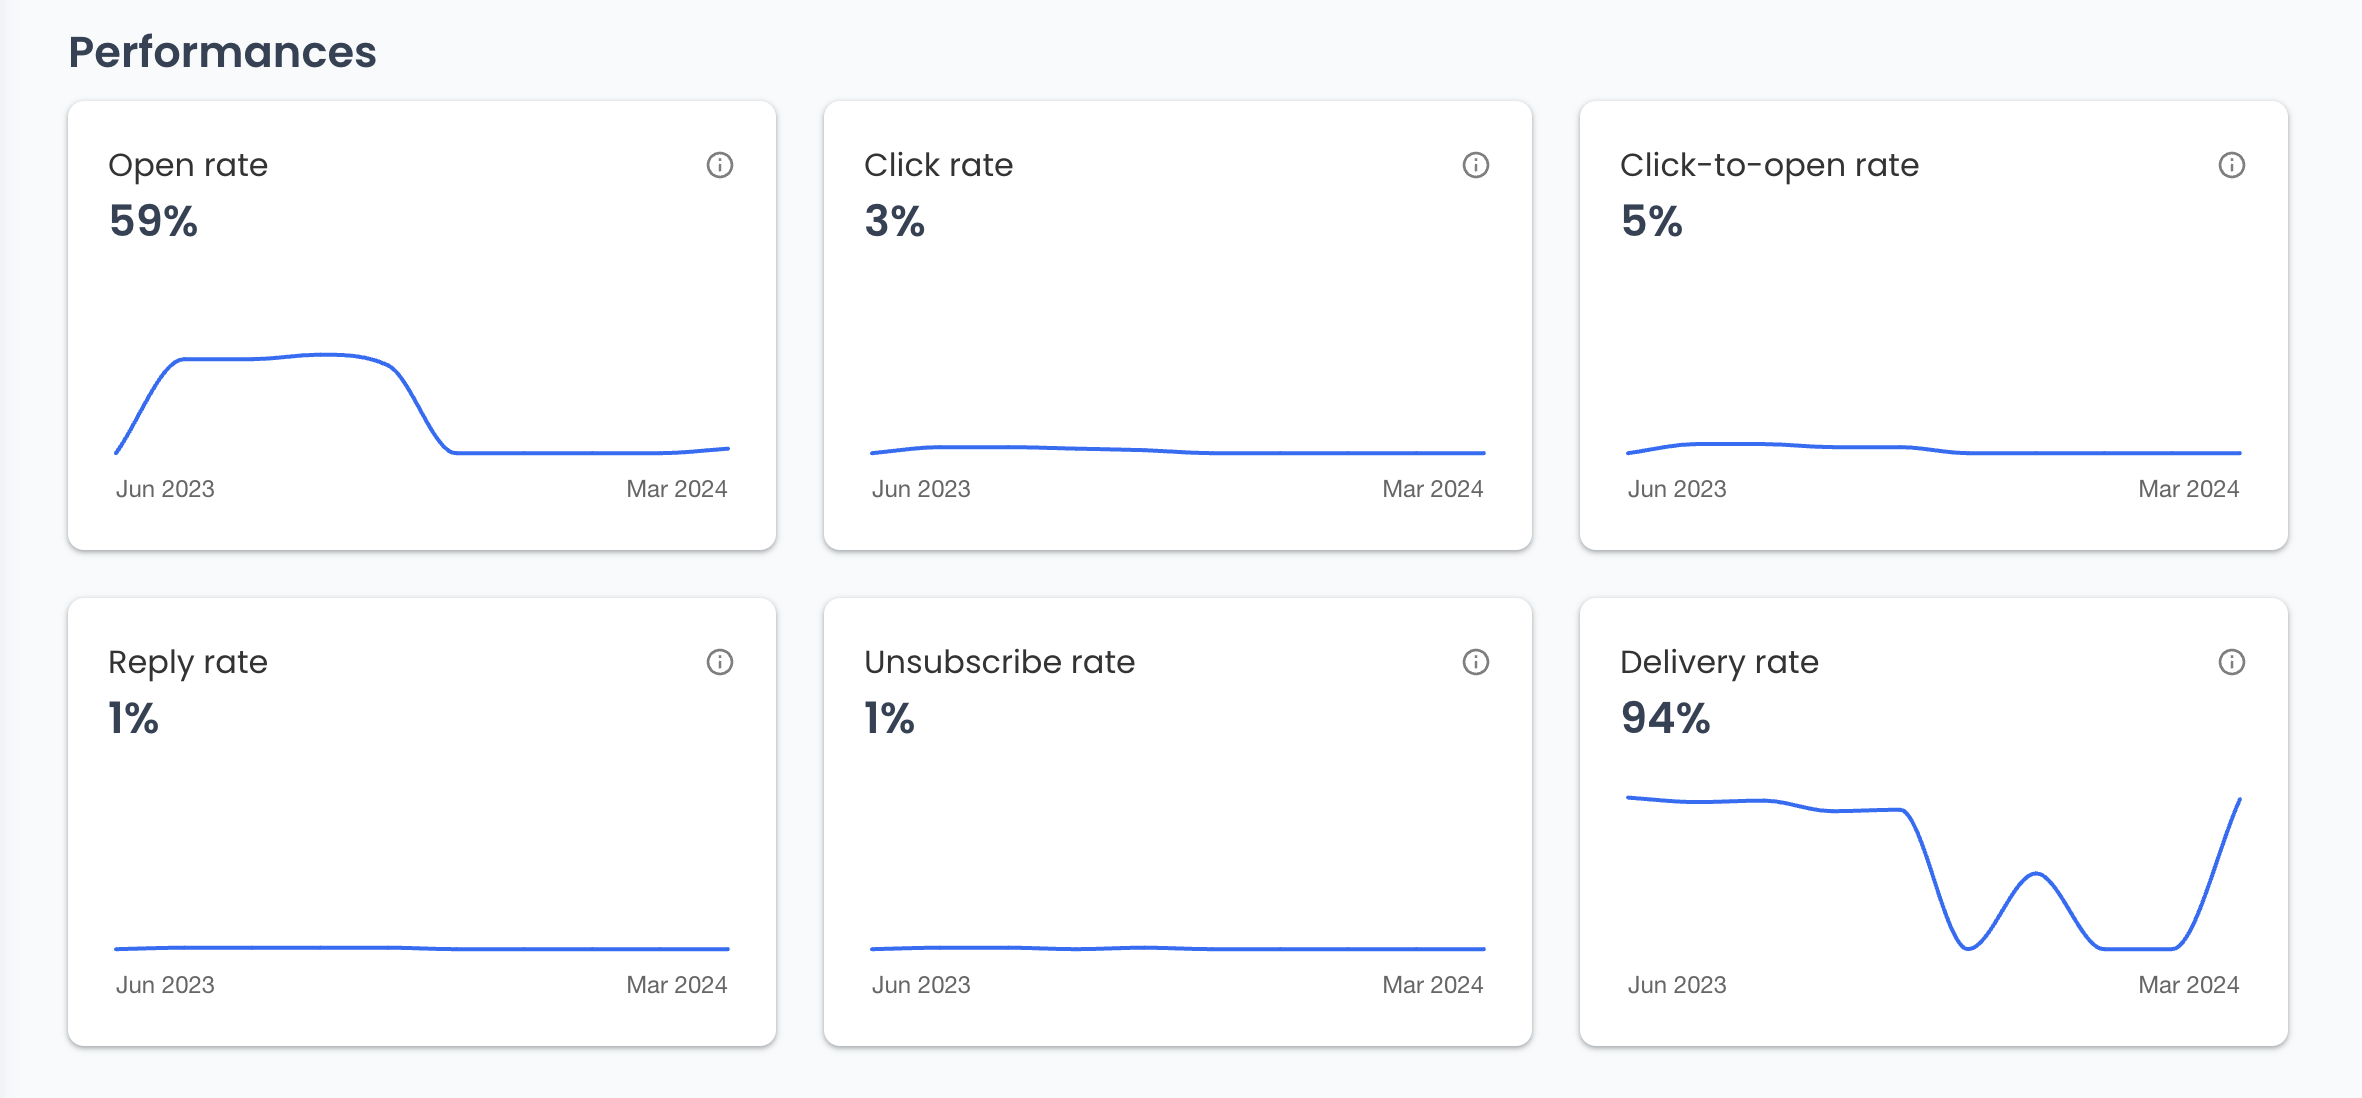
Lastly, you can access in-depth insights into your email performance, such as:
- Top links: Most frequently clicked links within emails. Several clicks by the same recipient count as one.
- Top contacts: Contacts who have most interacted with your emails. Interactions include opens, clicks and replies.
- Top campaigns: All your campaigns ranked by open rates.